
Turning Genesys Evaluations Into a Clear View of Contact Center Quality
The Challenge.
The quality team at a major Abu Dhabi real estate developer evaluates thousands of calls, emails and CRM tickets every year in Genesys Cloud. Every score was recorded, but none of it could be seen together. Standard Genesys quality views show results one evaluation or one form at a time, so any wider view meant exporting the data and rebuilding it by hand in Excel. This created several problems:
- No way to compare scores across 16 active evaluation forms in one place
- Hours of manual exporting, cleaning and pivot tables in Excel for every report
- Reports that were already out of date by the time they reached supervisors
- No visibility into which kill questions were causing evaluations to fail
- No month-by-month trend per agent, so coaching relied on the latest score only
- No consistent way to measure question-group performance across different forms

The QA team spent more time building reports than acting on them, and quality issues were often spotted weeks after they started.
Our Approach.
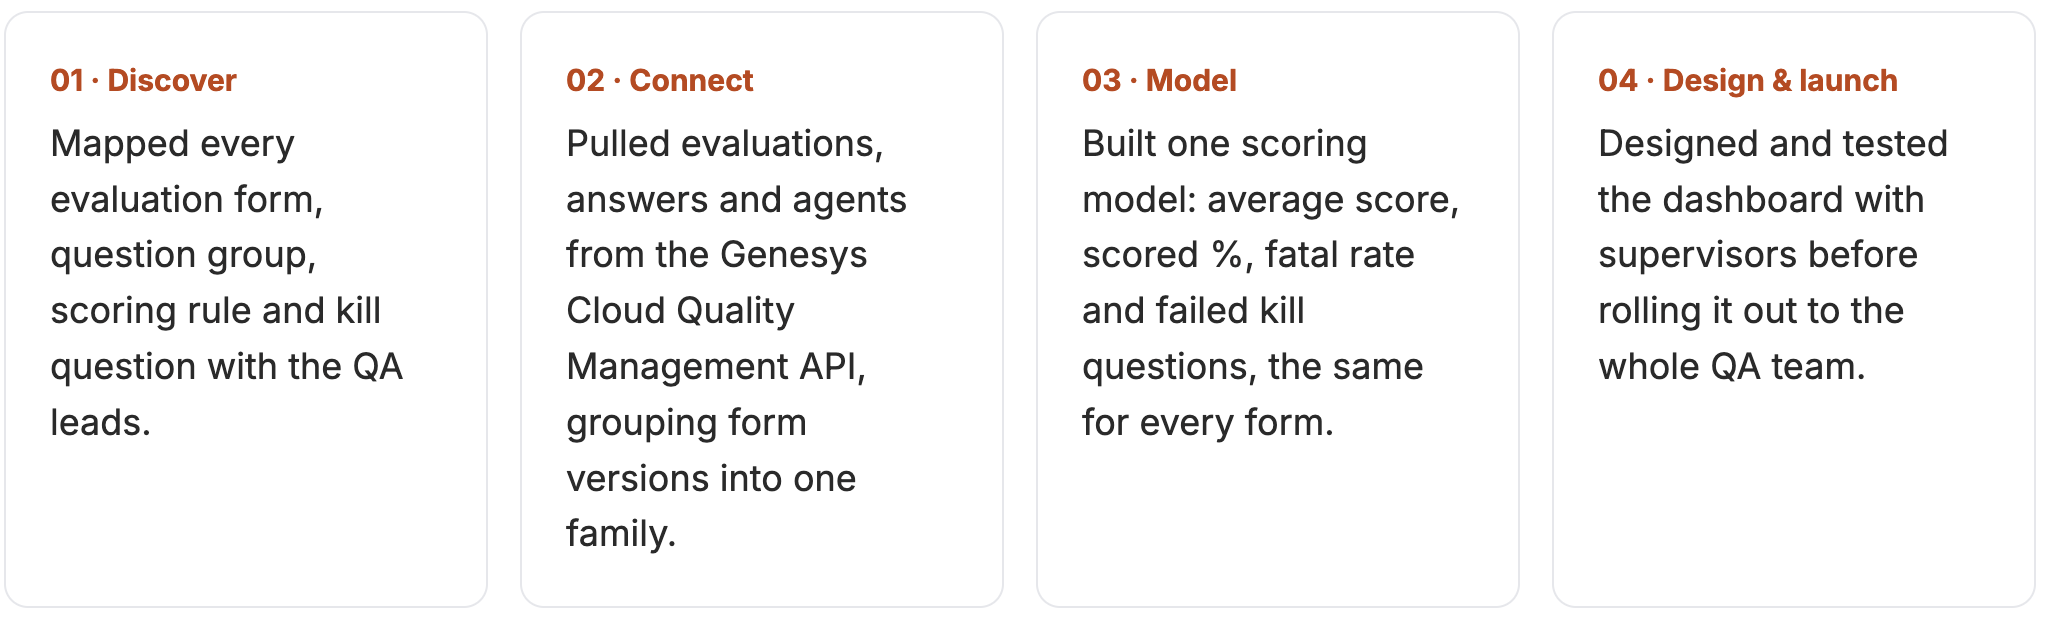
We treated the dashboard as a product for the QA team, not a one-off report. Every view was shaped by the questions supervisors ask each week.
The Solution.
A Quality Assurance Dashboard Built on Genesys Cloud
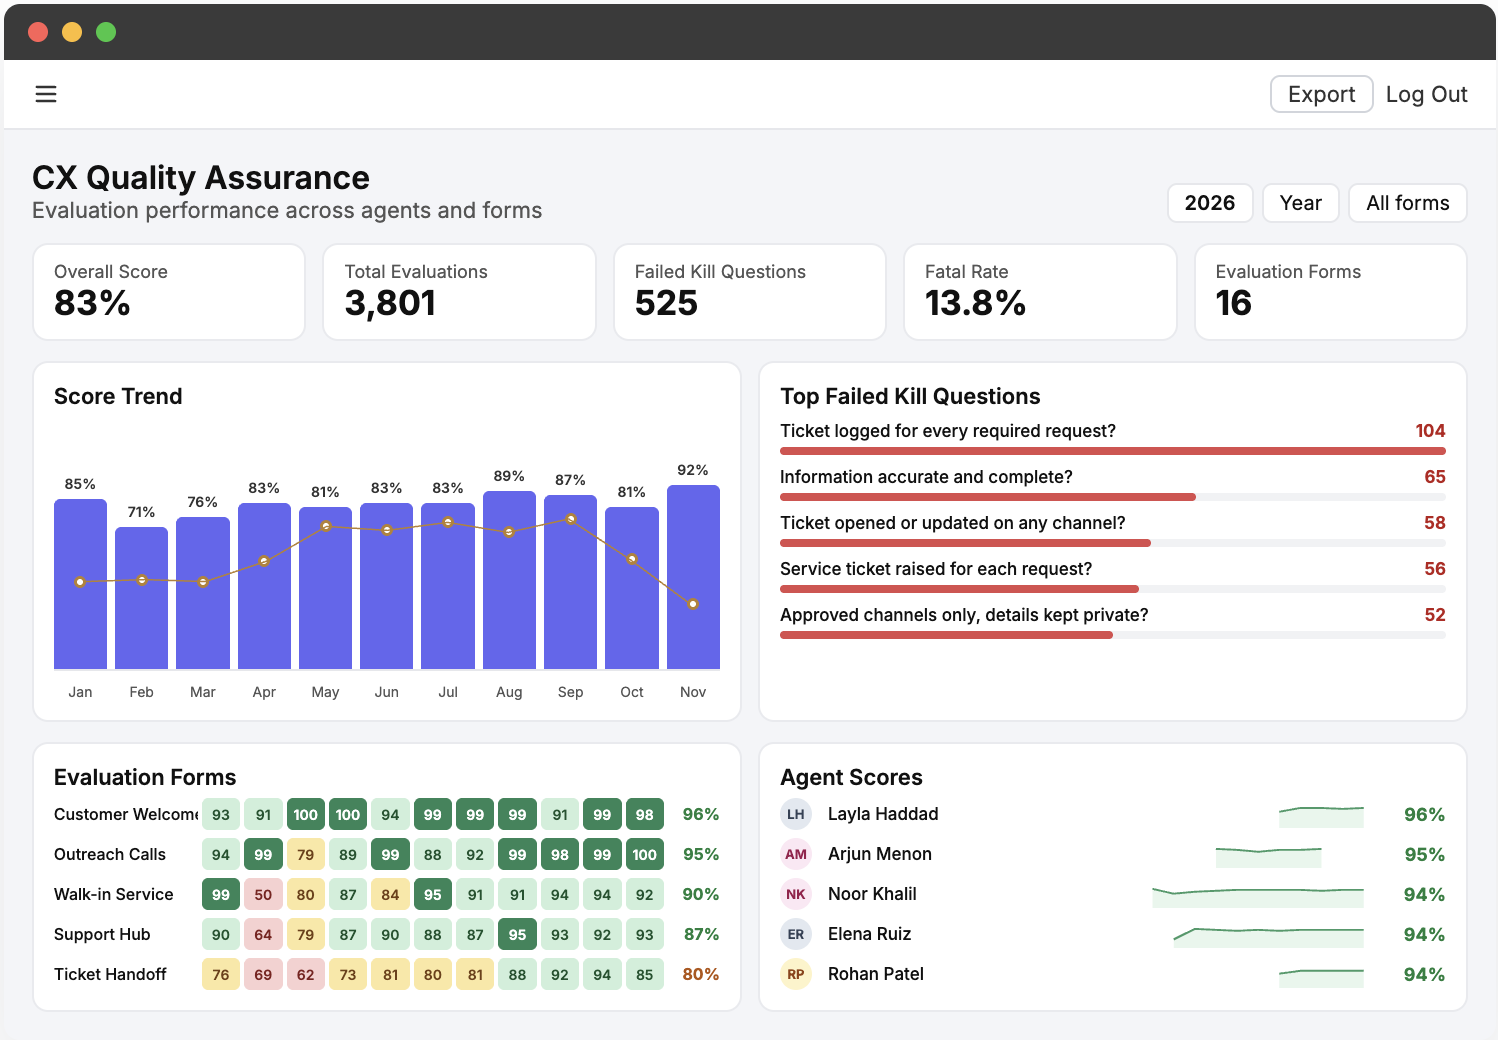
The CX Quality Assurance dashboard reads every evaluation directly from Genesys Cloud and turns it into one shared view for QA leads, supervisors and managers. Four views answer the four questions the team asks most. All names shown are anonymized.
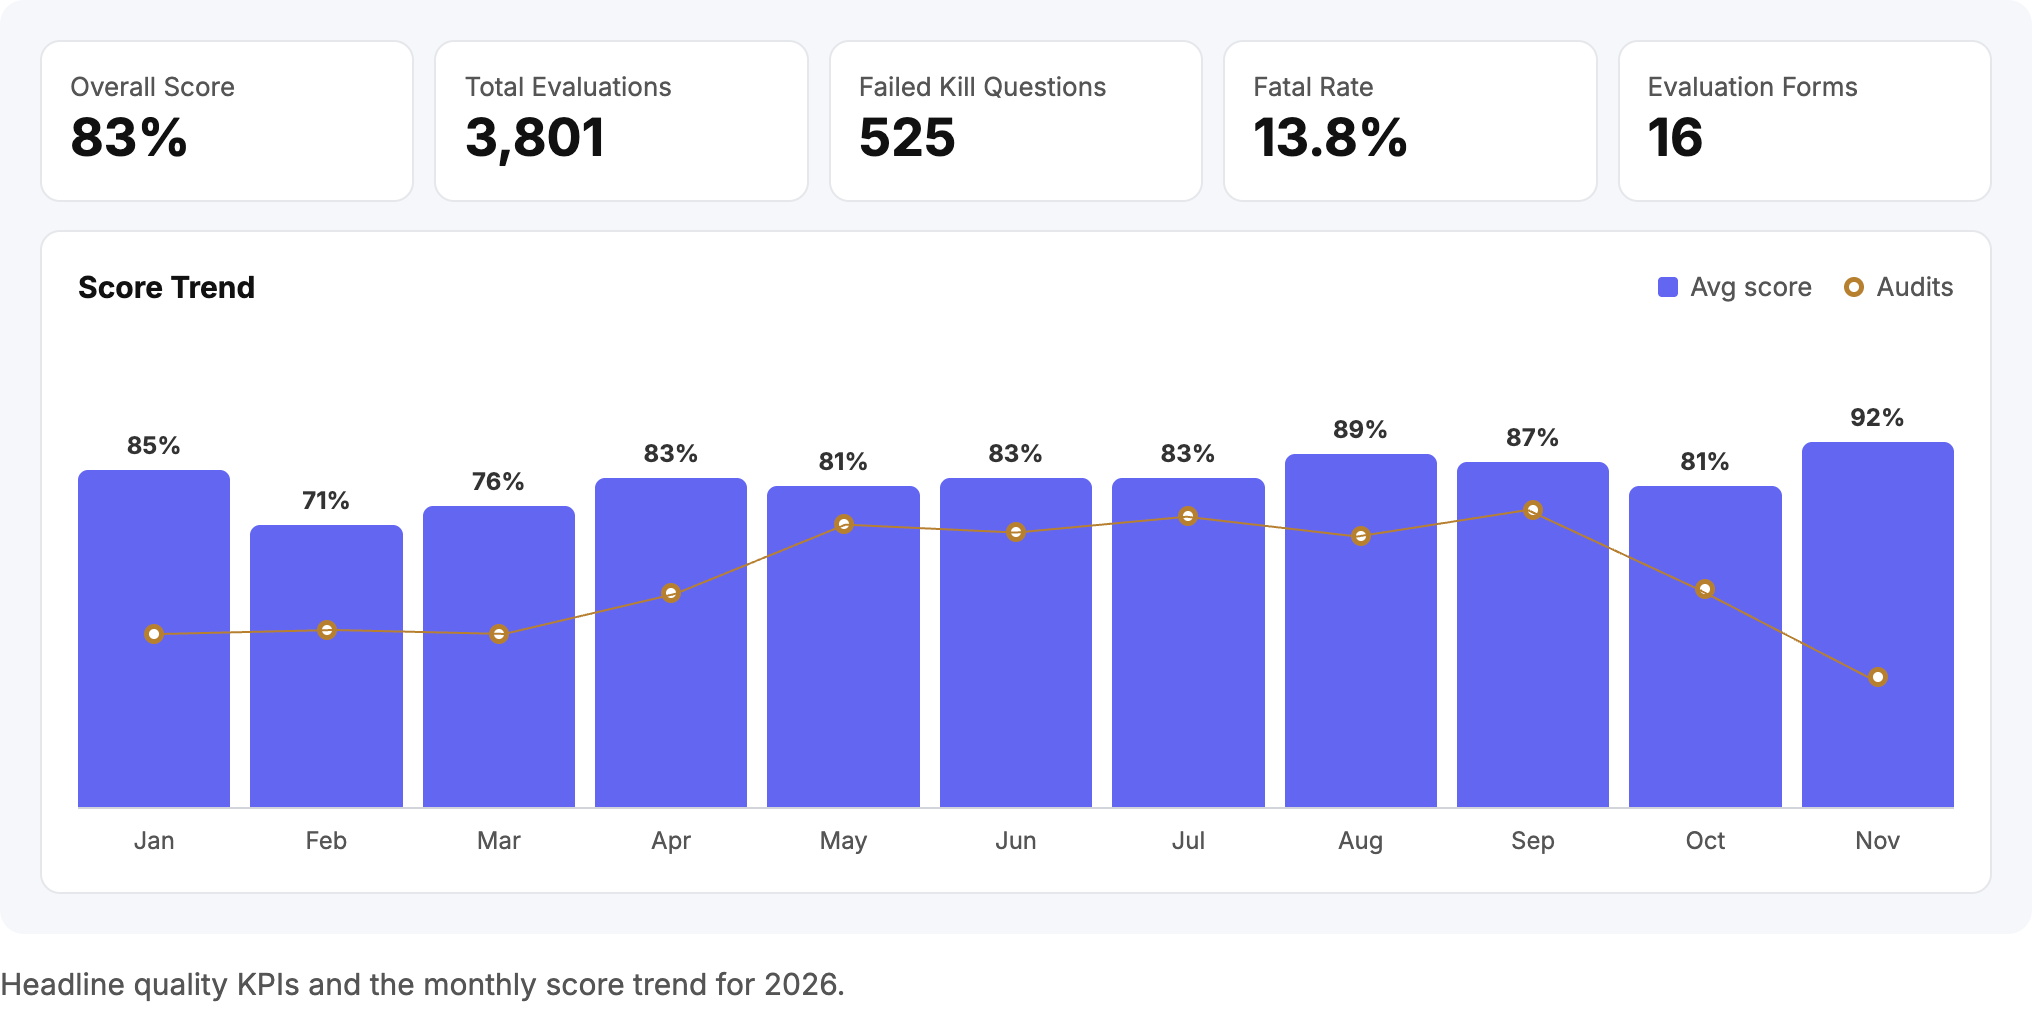
Quality KPIs and score trends
Five headline KPIs show overall score, total evaluations, failed kill questions, fatal rate and active forms, each compared with the previous year. The score trend plots average evaluation score against audit volume month by month, so a dip in quality is never hidden by a change in volume.
Evaluation form heatmap
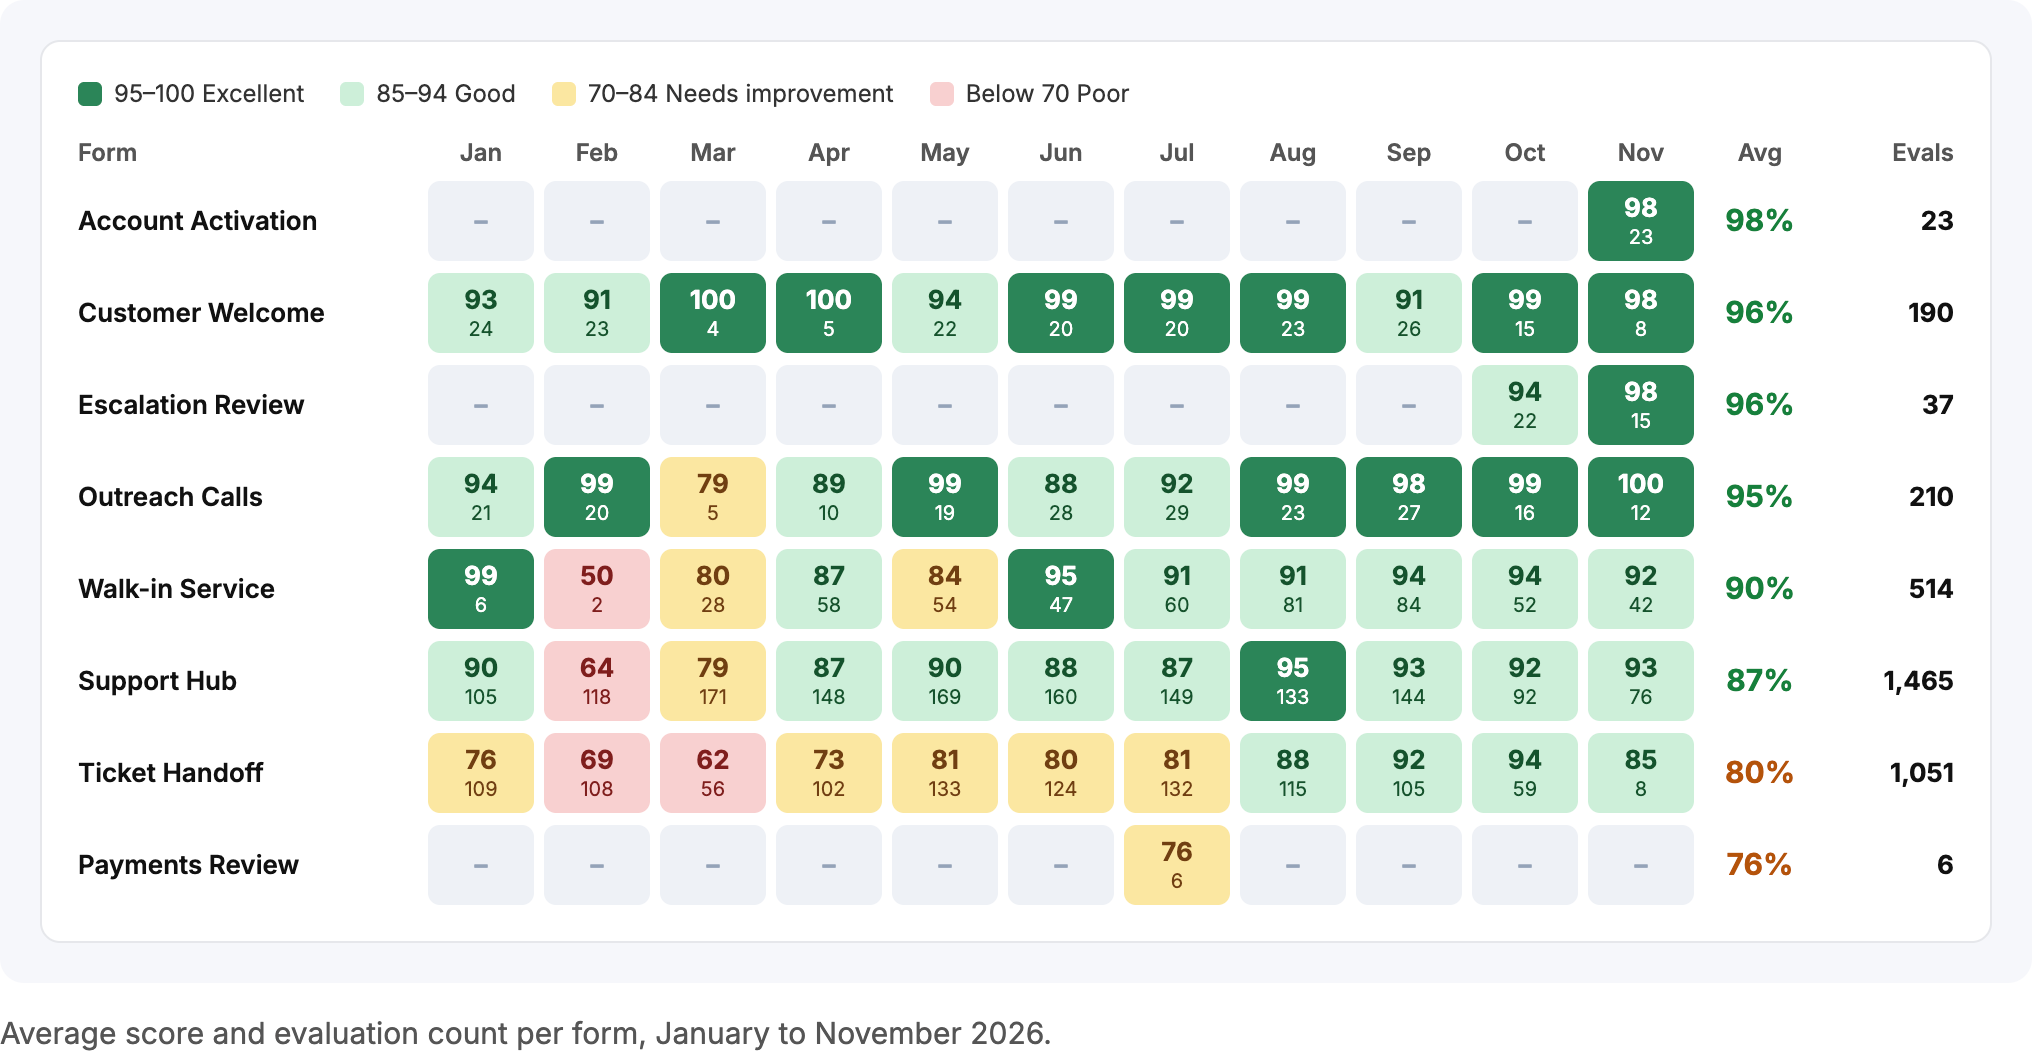
Every evaluation form appears month by month on one heatmap, color-coded from Excellent to Poor, with the number of evaluations in each cell. A struggling form now stands out at a glance instead of hiding in a separate export.
Agent performance leaderboard
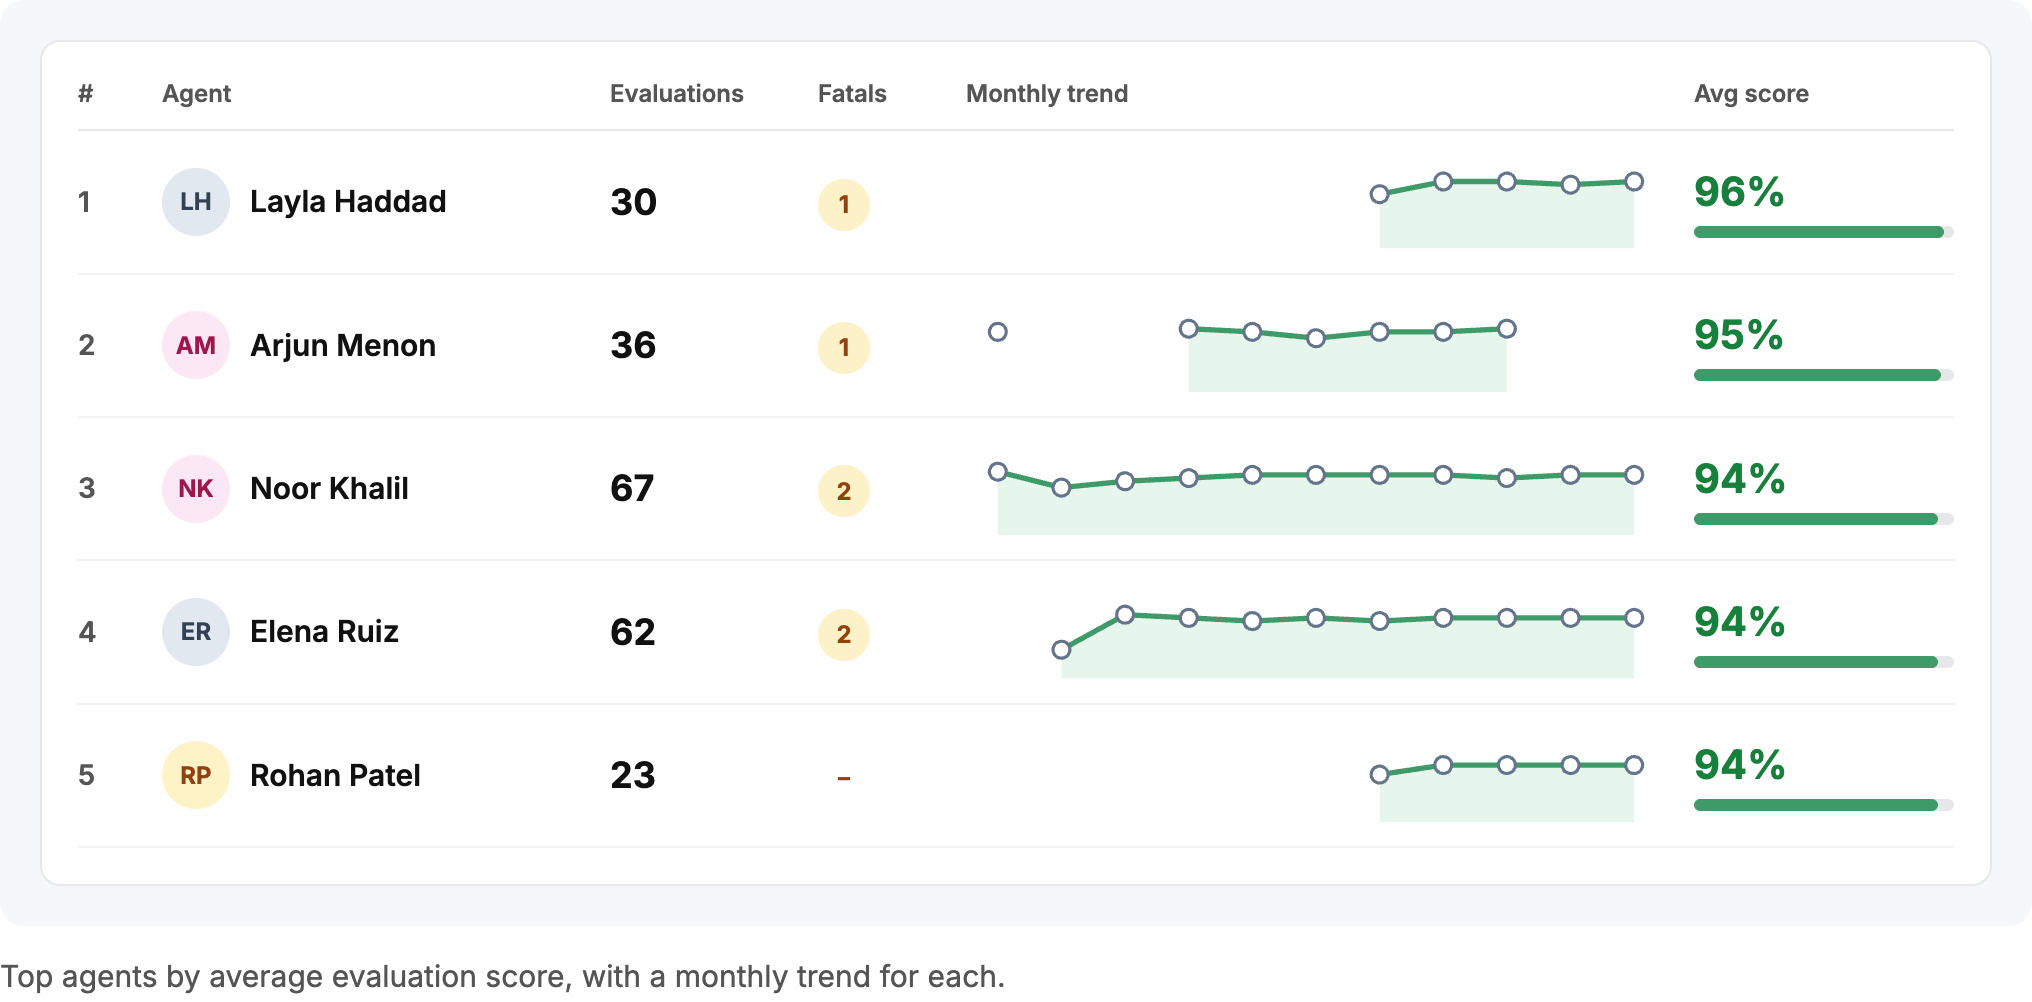
Agents are ranked by yearly average score, with their number of evaluations, fatal errors and a 12-month trend line. Supervisors can see who is improving, who is slipping and who is ready to mentor others.
Kill question and question group analysis
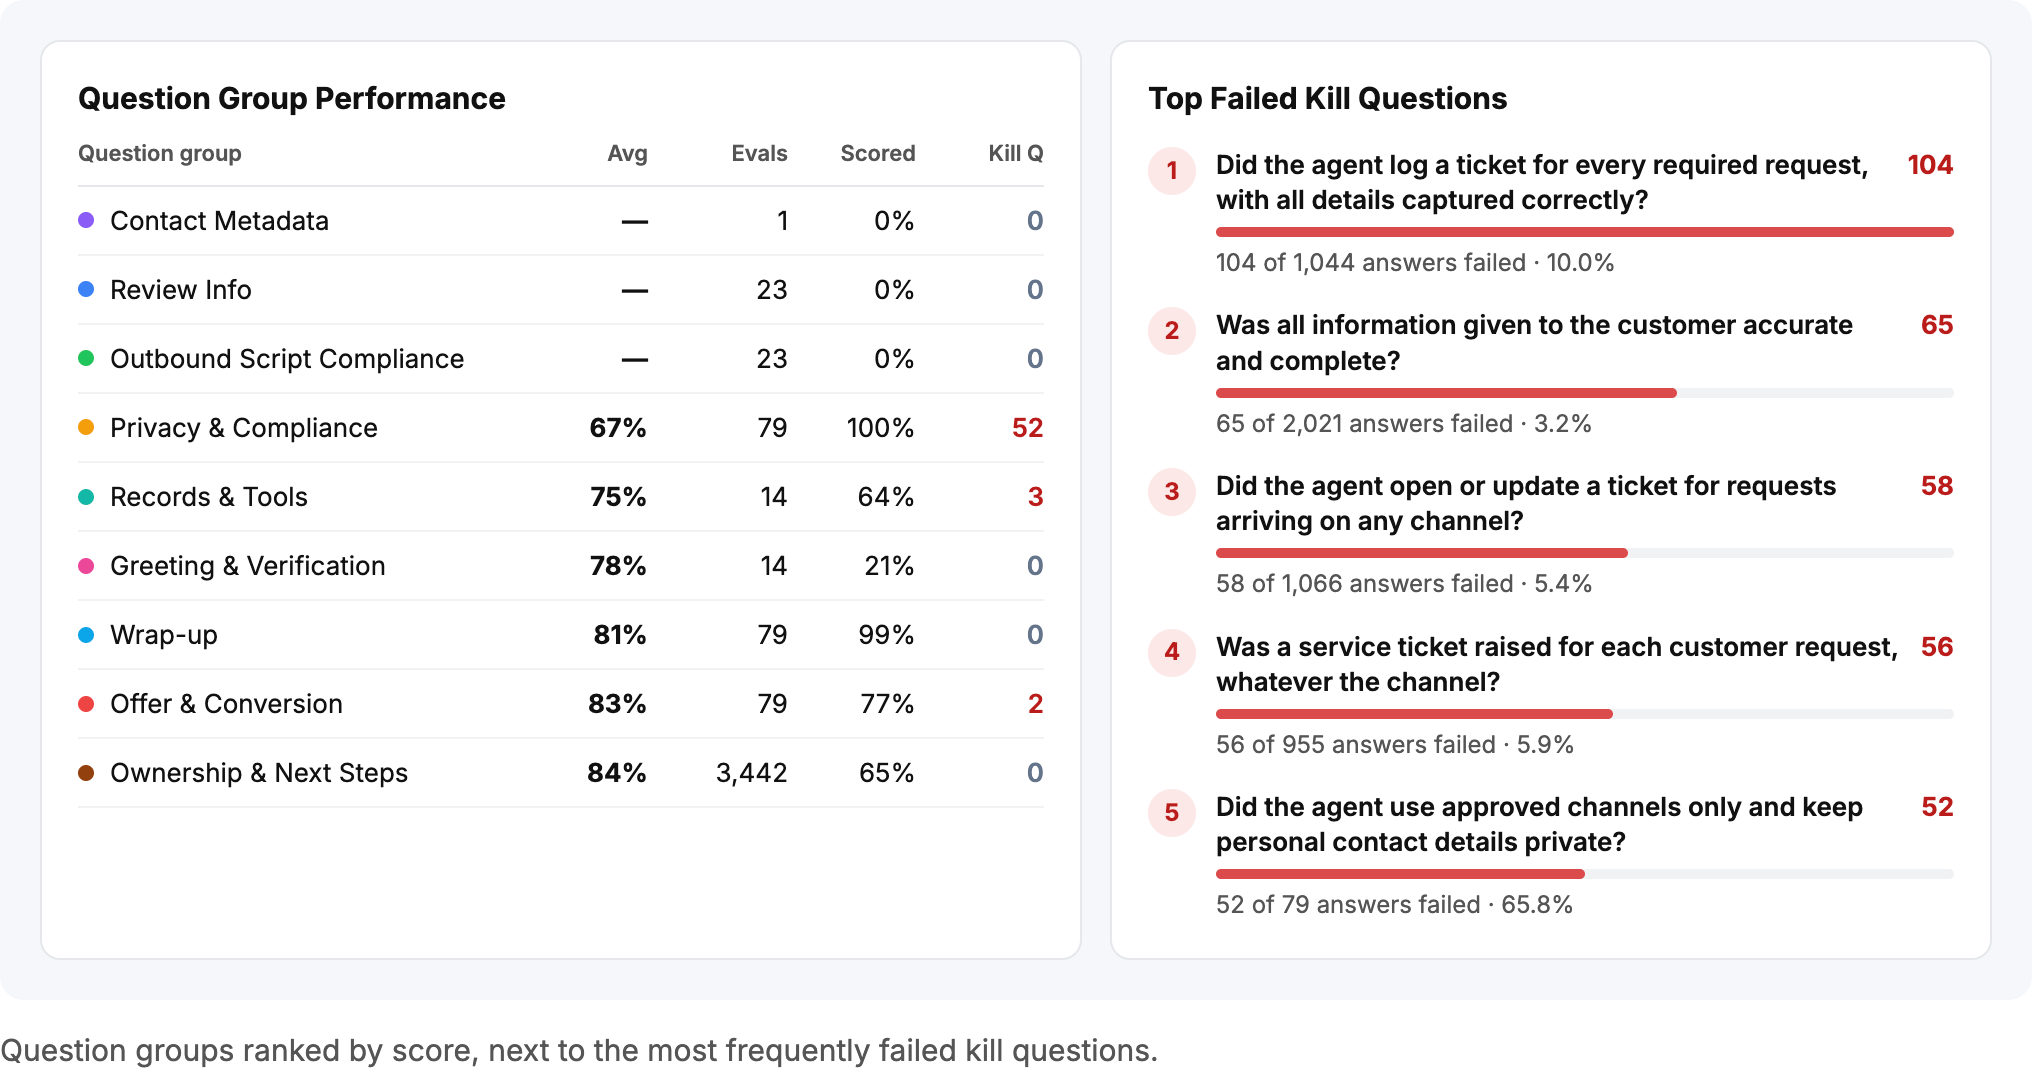
A single failed kill question sets an evaluation’s score to zero. The dashboard ranks question groups by average score and lists the kill questions failed most often across all forms, so training goes where it prevents the most failures.
Filters and export
Every view can be filtered by year, quarter or month and by one or many evaluation forms. When a report is needed outside the dashboard, one click exports it.
The Impact.
With every evaluation in one place, the QA team moved from building reports to acting on them.
- Manual Genesys exports and Excel reporting replaced by one live dashboard
- Ticket Handoff, with 1,051 evaluations, improved from 62% in March to 94% in October
- Support Hub, the largest form, climbed from 64% in February to 95% in August
- A privacy kill question failing in 65.8% of answers was identified as the top coaching priority
- Coaching is now based on monthly trends instead of single scores
Schedule a call.
Book a call with the Noralogix team. We look forward to talking to you.